Where are we in the crypto cycle? A data-driven look at Bitcoin market cycles
On this page
- Every crypto cycle feels different.
- Every cycle feels like the end
- How cycles are measured
- Bitcoin's bear-market Drawdowns
- The halving cycle: a recurring framework
- How long does it take to find a bottom?
- What marked previous turning points?
- What do market bottoms feel like?
- What makes this cycle different?
- The macro question
- What indicators provide context?
- Where does today's market sit?
- What the data cannot tell us
- Where are we in the crypto cycle?

Published: 22 June 2026
Market data and observations current as at: 22 June 2026
Cryptocurrency markets move quickly. Prices, indicators and market conditions may have changed since publication.
All Bitcoin prices and market values referenced throughout this report are denominated in US dollars (USD).
Every crypto cycle feels different.
The narratives change. New technologies emerge. Regulations evolve. New participants enter the market while others leave. Each cycle develops its own stories, catalysts and surprises.
The 2017 cycle is remembered for ICOs. The 2021 cycle became synonymous with NFTs, institutional adoption and unprecedented monetary stimulus. The cycle that peaked in October 2025 has been shaped by spot Bitcoin ETFs, corporate treasury strategies and growing regulatory clarity.
Yet despite these differences, Bitcoin has historically displayed recurring patterns that continue to attract the attention of market participants, analysts and researchers alike.
People often search for certainty during periods of uncertainty. Markets rarely provide it. History, however, leaves clues.
"History doesn't repeat itself, but it often rhymes."
— attributed to Mark Twain
So, where are we in the crypto cycle?
The honest answer is that nobody knows for certain. Historical patterns can provide useful context.
For many market participants, the question is not about predicting an exact bottom or top. It is about understanding how today’s market compares with previous cycles, and where risk may sit relative to them. Identifying whether a market is early, middle or late in a cycle can influence risk management, capital allocation and expectations.

Every cycle feels like the end
One thing previous cycles have in common is that the prevailing narrative near market lows is rarely “this is a buying opportunity.”
In early 2015, many believed Bitcoin would never recover from the collapse of Mt. Gox. Reputable commentators wrote eulogies for the asset class. Mainstream coverage was dismissive when it bothered to cover crypto at all.
In late 2018, confidence in the industry had been damaged by the collapse of the ICO boom. Thousands of projects had failed. Many investors who had entered near the 2017 peak swore they would never return.
In 2022, the failures of Terra, Celsius, Three Arrows Capital and FTX led many observers to question whether crypto itself could survive. Regulators promised crackdowns. Major media outlets ran obituaries. Even seasoned market participants admitted to genuine doubt.
Looking back, these periods became major turning points. Living through them felt very different.
Cycle lows rarely feel like lows in real time. They feel like the end.
How cycles are measured
The phrase “crypto cycle” gets used loosely. In Bitcoin, three related timeframes are commonly referenced:
Bull phase — the advance from a bear-market low to a new peak.
Bear phase — the decline from a peak back to a trough.
Full cycle — usually measured peak-to-peak or halving-to-halving, generally lasting around four years.
This article focuses primarily on the bear phase because that is where Bitcoin has historically shown the most consistent patterns, and where many “where are we now?” questions are concentrated.
A Note On Predictions. This article does not attempt to predict future prices or identify a market bottom. It examines how previous Bitcoin cycles behaved and compares those patterns with current conditions.
Bitcoin's bear-market Drawdowns
Despite different narratives each cycle, each bear phase has ultimately followed a familiar sequence: rapid markdown, sustained pessimism, and eventually a period of rebuilding.
Figure 1 — Bitcoin Bear-Market Drawdowns
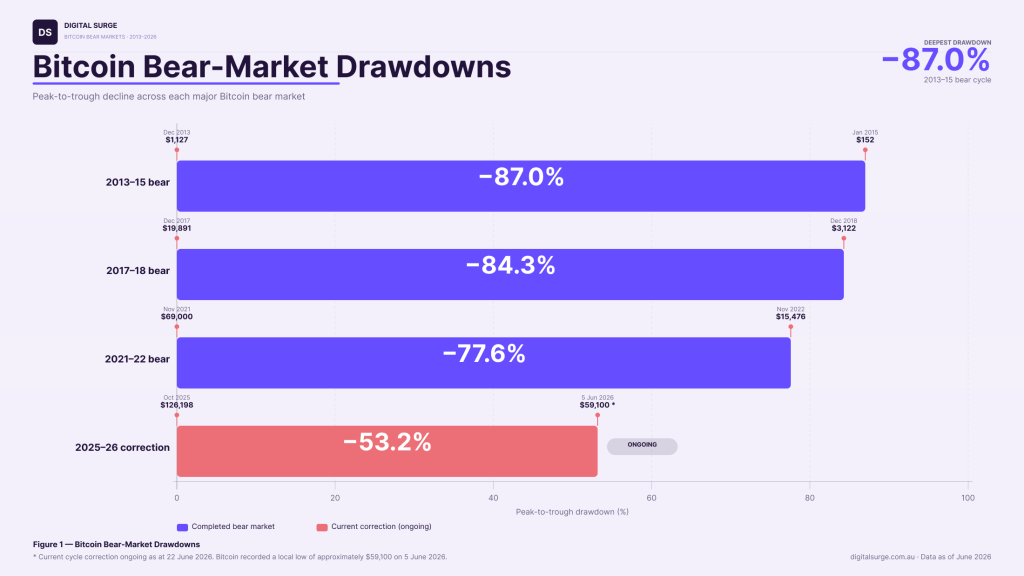
Two patterns stand out.
The first is that bear-market drawdowns have become less severe over time, falling from −87% in 2015 to −84% in 2018 and −78% in 2022. The current cycle has so far seen approximately a −53% drawdown, significantly less severe than previous bear markets, although the correction remains ongoing.
While Bitcoin remains one of the most volatile major assets in the world, the magnitude of its worst declines has generally softened with each cycle.
The second is that cycle returns have also compressed. Bitcoin rose approximately 131 times from its 2015 low to its 2017 peak, around 22 times from its 2018 low to its 2021 peak, and roughly 8 times from its 2022 low to its October 2025 peak.
The asset remains volatile, but the upside per cycle appears to be compressing just as the downside is.
Both drawdowns and cycle returns have compressed with each cycle. This is consistent with Bitcoin maturing into a larger, more widely held asset. Whether that trend continues remains an open question.
The halving cycle: a recurring framework
The halving — the programmed event every four years that halves the rate of new Bitcoin issuance — remains the most widely referenced Bitcoin cycle framework. Every previous halving has been followed by a sustained advance that eventually culminated in a major correction.
| Halving | Date | Subsequent Peak | Days From Halving |
|---|---|---|---|
| First | Nov 2012 | Dec 2013 | ~371 |
| Second | Jul 2016 | Dec 2017 | ~525 |
| Third | May 2020 | Nov 2021 | ~547 |
| Fourth | Apr 2024 | Oct 2025 | ~540 |
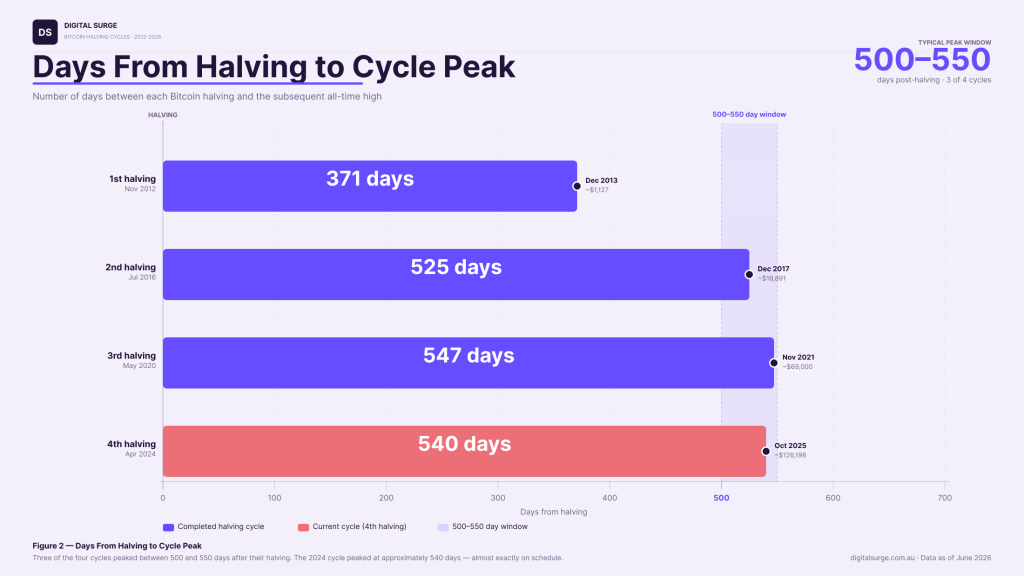
Three of the last four cycles peaked between 500 and 550 days post-halving. The cycle that peaked in October 2025 did so approximately 540 days after the April 2024 halving, almost exactly in line with previous cycles. In March 2024, Bitcoin reached a new all-time high before its halving, which had never previously occurred.
While the halving is not a guarantee of future market behaviour, the consistency of this timing remains one reason it continues to be one of the most closely watched cycle frameworks in Bitcoin.
Figure 2 — Days From Halving To Cycle Peak
How long does it take to find a bottom?
Price is only one part of the story. Time is often just as important.
One of the most surprising observations from previous cycles is how long major market bottoms can take to form. During bear markets, many assume the worst declines occur quickly. In reality, the process of unwinding leverage, speculation and excessive optimism has historically taken many months.
| Bear Market | Peak | Bottom | Days |
|---|---|---|---|
| 2013-15 | Dec 2013 | Jan 2015 | 406 |
| 2017-18 | Dec 2017 | Dec 2018 | 364 |
| 2021-22 | Nov 2021 | Nov 2022 | 377 |
| Average | ~382 |
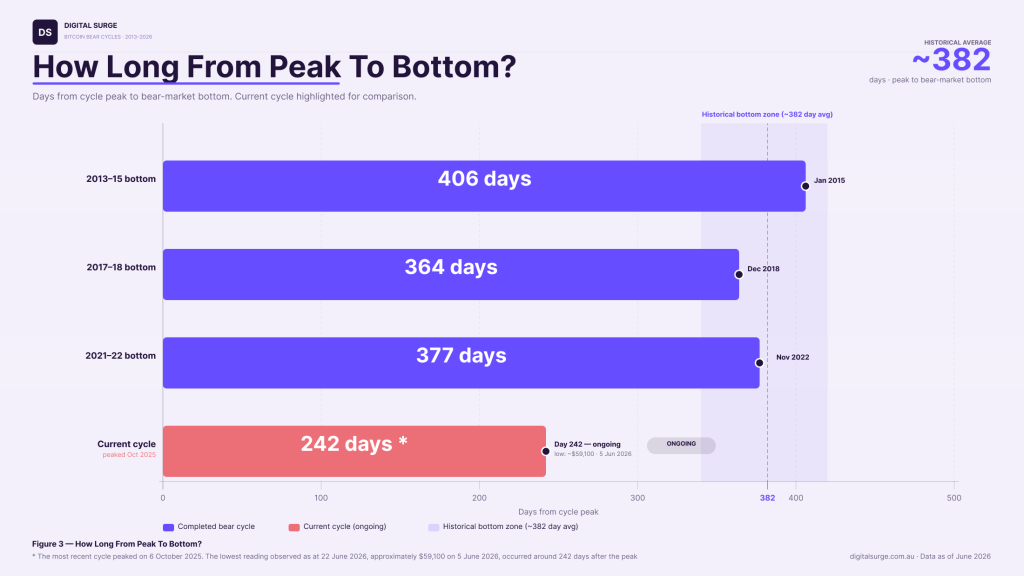
The consistency is striking. While every cycle develops differently, the transition from peak optimism to maximum pessimism has historically been measured in months rather than weeks.
For reference, the most recent cycle peaked on 6 October 2025. The lowest reading observed as at 22 June 2026, approximately $59,100 on 5 June 2026, occurred around 242 days after the peak, still well short of the historical average of 382 days.
Whether June’s low ultimately marks the cycle bottom, or merely a stop along the way, remains genuinely uncertain.
Figure 3 — How Long From Peak To Bottom?
What marked previous turning points?
Major cycle lows have rarely occurred during periods of optimism. Instead, they have emerged when confidence in the market appeared severely damaged.
2015 — The Mt. Gox Aftermath
By early 2015, Bitcoin was near $150, down 87% from its 2013 peak. The Mt. Gox collapse had shaken confidence in crypto infrastructure. Mainstream coverage was dismissive. Most retail investors had given up. Trading volumes were a fraction of their peak. In hindsight, that period proved to be a major turning point for Bitcoin.
2018 — The ICO Collapse
By December 2018, Bitcoin had fallen to $3,122, down 84%. The 2017 ICO boom had imploded. Most projects collapsed or were regulated out of existence. Conferences emptied. Many market participants swore they would never return. That period ultimately marked the end of the bear market and the beginning of a new cycle.
2022 — Terra, Celsius, Three Arrows Capital and FTX
By November 2022, Bitcoin had fallen to $15,476, down 78%. A cascade of failures including Terra/Luna, Celsius, Voyager, Three Arrows Capital and ultimately FTX led many observers to publicly question whether crypto could survive. Roughly a year later, Bitcoin had begun a new cycle that ultimately took it to a new all-time high.
While the catalysts differed, the pattern was remarkably similar. Each major low emerged after a period when many market participants questioned whether the industry itself could recover. In hindsight, those periods of maximum pessimism became the foundation for the next cycle.
Previous cycles have generally reached their lowest point when sentiment was overwhelmingly negative and confidence in the industry's future appeared deeply damaged.
What do market bottoms feel like?
The data can describe where bottoms occurred. It is harder to convey what they felt like to live through. Yet this texture is often as informative as the numbers themselves.
Major crypto market bottoms have often shared a distinct atmosphere, one that differs markedly from the sharp, dramatic crashes that precede them.
Declining volumes and low engagement
Trading volumes compress. Fewer people are watching prices. Social media discussion dries up. The energy of the bull market has simply evaporated.
Boredom, not panic
The deepest lows often feel less dramatic than the sharp declines that precede them. By the time a market reaches its ultimate low, the panic has often already passed. What remains is fatigue, indifference and a lack of interest.
Disbelief rallies
False starts are common near cycle lows. Bitcoin might recover 20-30% from a low, only to sell off again. These moves are dismissed as dead-cat bounces, which is, paradoxically, one reason they eventually become the foundation for the next sustained advance.
Reduced media coverage
The mainstream media largely stops covering crypto. When coverage does appear, it is dismissive or retrospective, explaining why crypto failed. Negative framing dominates.
Fewer new participants
Exchange signups slow dramatically. The cycle of friends and family asking about Bitcoin, which tends to peak near cycle highs, has reversed. The asset has become boring or embarrassing to discuss.
Long-term holders accumulating quietly
On-chain data from previous cycles shows that while retail activity compresses near bottoms, experienced holders tend to accumulate. Coins move from weak hands to strong hands, often without making headlines.
The current market exhibits some of these characteristics. Sentiment has moderated from extremes, and on-chain accumulation patterns are visible among certain cohorts. However, volumes and engagement have not yet compressed to the degree seen at previous confirmed bottoms, and broader conversation about crypto remains relatively active.
What makes this cycle different?
History rhymes, but every cycle introduces new developments. Several structural changes have reshaped the crypto market since previous cycle lows.
One reason direct comparisons with previous cycles have become more difficult is that the market itself has changed significantly. Earlier Bitcoin cycles were largely driven by retail participation, with sentiment heavily influenced by individual investors, crypto-native traders and speculative capital. Today, the ecosystem includes a much broader range of participants, from institutional investors and public companies to governments, asset managers and payment providers.
The infrastructure supporting the market has also matured. Spot Bitcoin ETFs now provide regulated access to Bitcoin through traditional brokerage accounts, stablecoins have become a global settlement layer facilitating hundreds of billions of dollars in value transfer, and regulatory frameworks are gradually becoming clearer in several major jurisdictions. Crypto is no longer operating entirely on the fringes of the financial system.
Spot Bitcoin ETFs. Spot Bitcoin ETFs allow large-scale institutional capital to access Bitcoin through regulated products that integrate directly with traditional financial markets. ETFs absorbed an enormous amount of supply following their January 2024 launch while also introducing a new and visible source of buying and selling pressure during market corrections.
Corporate Treasury Strategies. Strategy (formerly MicroStrategy) accumulated roughly 846,842 Bitcoin by mid-2026, transforming itself into a leveraged Bitcoin treasury company. Other firms, including Japan’s Metaplanet (~30,800 BTC), have adopted similar approaches. Corporate treasury holdings now represent a meaningful source of demand that did not exist during previous cycles.
Sovereign Adoption. As of mid-2026, El Salvador holds roughly 7,475 BTC. The United States announced a Strategic Bitcoin Reserve in early 2025, while several US states have passed legislation permitting Bitcoin reserves. None of this existed during previous Bitcoin cycles.
Stablecoin Infrastructure. The stablecoin market has grown from under $5 billion at the 2018 cycle low to more than $300 billion in 2026. Stablecoins now function as the primary settlement and liquidity layer for much of the crypto ecosystem, allowing capital to move more efficiently between exchanges, protocols and markets than in previous cycles.
Regulatory Maturity. Previous cycles unfolded amid significant regulatory uncertainty. While regulation remains uneven globally, the approval of spot Bitcoin ETFs, the development of stablecoin frameworks and growing institutional participation have created a more mature environment than existed during earlier Bitcoin cycles.
Taken together, these developments mean today’s market includes participants operating on different time horizons and responding to different incentives than the retail-driven flows that dominated earlier cycles. Historical patterns remain useful, but the environment in which those patterns are unfolding has evolved considerably.
The macro question
Previous Bitcoin cycles were largely internal to crypto. Today’s market is increasingly linked to broader financial conditions. The macro environment has become one of the most important variables in assessing where crypto sits in its cycle.
Several macroeconomic forces now play a larger role in crypto markets than they did in previous cycles:
Interest rates and the cost of capital
Higher interest rates increase the opportunity cost of holding volatile assets. Rate cuts, or credible expectations of them, have historically provided a tailwind for risk assets. The trajectory of the US Federal Reserve remains a key variable for the crypto cycle.
Global liquidity
Many analysts now view global liquidity as a major driver of crypto markets. When central banks expand balance sheets and money supply grows, more capital tends to flow into risk assets, including crypto. Some analysts now consider global liquidity to be as important as the Bitcoin halving when assessing cycle timing.
Equity market correlation
Unlike previous bear markets, the current correction has occurred while many traditional financial markets remain near all-time highs. This highlights that the relationship between Bitcoin and traditional markets is not always straightforward. While macroeconomic conditions remain important, crypto-specific factors may also be influencing the current cycle.
Recession risk and credit conditions
Recessions tend to create headwinds for all risk assets. The crypto-specific concern is leverage: if a sharp contraction forces institutional holders or treasury companies to liquidate positions, selling pressure could be amplified in ways not seen in previous cycles.
US dollar strength
Bitcoin has historically tended to face headwinds when the US dollar strengthens. A stronger dollar generally signals more cautious market conditions globally. The direction of the DXY remains a closely watched indicator.
Geopolitical risk
The 2025–2026 period has seen elevated uncertainty, including ongoing conflicts, oil price volatility and political transitions. These factors can contribute to risk-off sentiment that weighs on volatile assets, including crypto.
Unlike previous cycles, Bitcoin no longer exists in isolation. Increasingly, investors must consider both crypto-specific indicators and broader macroeconomic conditions.
What indicators provide context?
Technical and on-chain indicators cannot predict future prices. What they can do is provide context by placing today's market within a broader historical range.
RSI and Stochastic RSI
RSI and Stochastic RSI are momentum indicators that help measure whether markets appear stretched to the upside or downside. During previous bear markets, Bitcoin's weekly RSI fell below 30 before major bottoms formed. Stochastic RSI typically reached even more extreme readings before reversing.
MVRV Z-Score
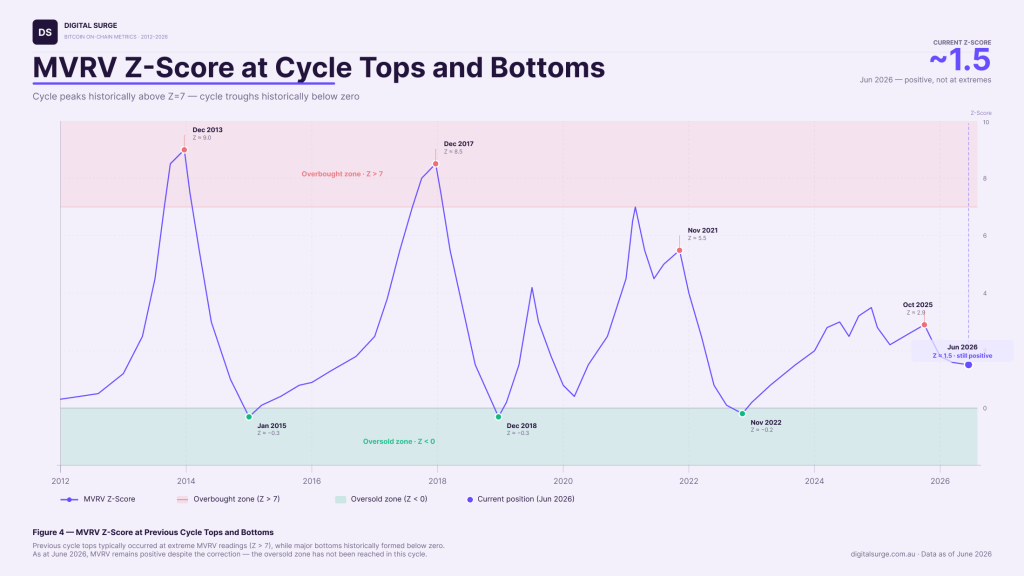
The MVRV Z-Score compares Bitcoin's market value to its realised value, the average price at which all Bitcoin last moved. Readings above 7 have historically coincided with major cycle tops, while readings below zero have often accompanied major cycle lows.
The October 2025 peak did not reach the extreme readings observed at some previous cycle tops, continuing the broader pattern of cycle compression. Likewise, the current correction has not pushed MVRV into deeply negative territory. While the indicator has compressed significantly from its 2025 highs, it remains above levels that historically marked the deepest points of prior bear markets.
Figure 4 — MVRV Z-Score at Previous Cycle Tops and Bottoms
Realised Price and Cost Basis
In previous cycles, bottoms have formed near or slightly below the network's realised price, when the average holder is sitting on an unrealised loss. For this reason, realised price is often monitored as a rough reference point during major corrections.
Fear & Greed Index
Extreme fear has historically tended to occur near major lows, while extreme greed has often appeared near major highs. During the February and June 2026 sell-offs, sentiment briefly reached extreme-fear levels comparable to previous periods of market stress. You can view the Crypto Fear & Greed index here.
Global Liquidity
Global liquidity has gained significant attention in recent years. Many analysts now monitor changes in money supply and central bank balance sheets alongside traditional crypto indicators when assessing market conditions.
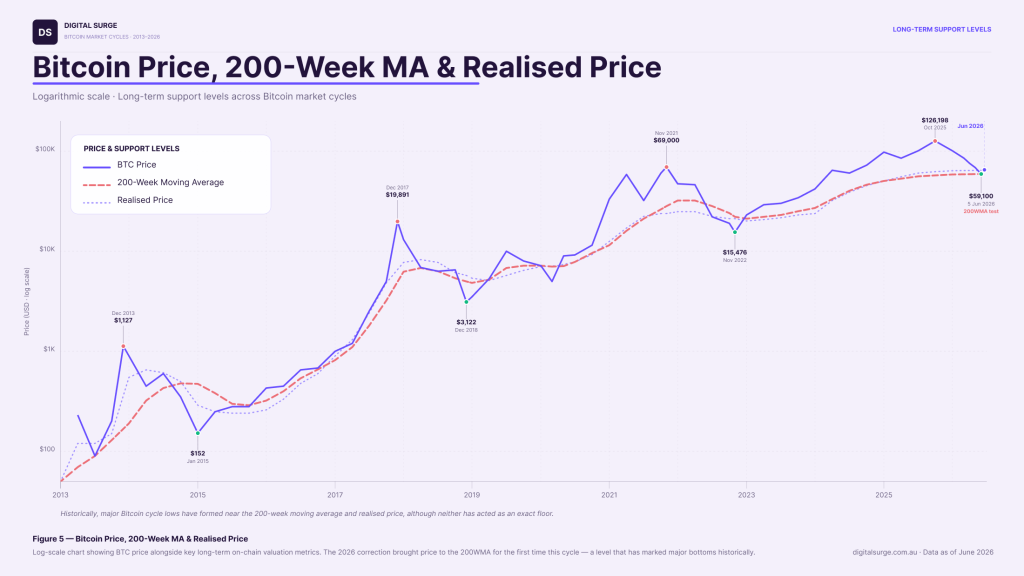
The 200-Week Moving Average
The 200-week moving average smooths years of price data, providing a useful proxy for Bitcoin's long-term trend. In each of the last two major bear markets, Bitcoin briefly traded below the 200-week moving average before recovering. While widely followed, the level has never been an exact floor.
Figure 5 — Bitcoin Price, 200-Week Moving Average and Realised Price
Where does today's market sit?
History cannot tell us what happens next. It can, however, provide a framework for comparison.
The evidence reviewed throughout this report presents a mixed picture. Several indicators associated with previous cycle lows have moved closer to historical bottom territory. The current correction has exceeded 50%, weekly RSI briefly reached oversold levels during the February 2026 sell-off, and sentiment touched extreme fear during both the February and June corrections. Bitcoin later reached a low of approximately $59,100 in June 2026, representing its deepest decline of the current cycle.
Other indicators remain less extreme than at previous major bottoms. Bitcoin briefly traded into its 200-week moving average during 2026 but has not yet recorded a weekly close below it. MVRV Z-Score has not fallen into negative territory, and the current correction remains younger than previous cycle lows when measured by time from peak. Historically, major bear-market bottoms have occurred after an average of approximately 382 days, compared with roughly 259 days had passed since Bitcoin’s October 2025 all-time high as at 22 June 2026.
| Indicator | Current Cycle (as at 22 Jun 2026) | Previous Cycle Bottoms |
|---|---|---|
| Deepest Drawdown | ~-53% (5 Jun 2026) | -77% to -87% |
| Days From Peak | ~259 | ~382 average |
| Weekly RSI | Briefly fell below 30 | Oversold (<30) readings |
| 200-Week Moving Average | Price tested the 200WMA | Brief closes below the 200WMA |
| MVRV Z-Score | Above 0 | Below 0 |
| Fear & Greed | Extreme fear | Extreme fear conditions |
The broader backdrop is also different from previous cycles. Spot Bitcoin ETFs, corporate treasury strategies, sovereign adoption, stablecoin infrastructure and a more mature regulatory environment have introduced market dynamics that did not exist during earlier bear markets. At the same time, macroeconomic conditions now exert greater influence on crypto than they did in prior cycles.
None of these factors invalidate historical patterns. However, they do make direct comparisons more difficult than they might first appear.
What the data suggests
The current market shares some characteristics of previous cycle lows, but not all of them. Several indicators suggest a meaningful reset has already occurred. Others imply that conditions remain less extreme than those seen at previous major bottoms. The result is a market that sits somewhere between a typical post-cycle correction and the deeply pessimistic conditions that historically marked Bitcoin’s most significant lows.
None of these factors invalidate historical patterns. However, they do make direct comparisons more difficult than they might
Taken together, the evidence suggests a market that has undergone a substantial correction and sentiment reset, while remaining less extreme than previous major cycle lows across several key indicators.
What the data cannot tell us
Every cycle produces confident predictions about what comes next.
Some argue the market has already found its cycle bottom during the 2026 correction. Others expect significantly lower prices. Some believe institutional adoption has permanently changed Bitcoin’s behaviour. Others expect previous cycle patterns to continue.
The data presented throughout this report provides useful context, but it cannot resolve these debates with certainty.
History suggests caution with all of these views. Those who successfully navigated previous cycles were rarely the ones who predicted every market move correctly. More often, they were those who managed risk, remained patient and avoided becoming overly attached to any single narrative.
Markets have a habit of surprising both optimists and pessimists. The future remains uncertain. That uncertainty is not a flaw. It is simply the nature of markets.
The purpose of historical analysis is not to predict the future with certainty. It is to provide context, improve decision-making and help people navigate uncertainty with a clearer understanding of the past.
Where are we in the crypto cycle?
As at 22 June 2026, roughly 259 days had passed since Bitcoin’s October 2025 all-time high. The market has corrected by more than 50%, sentiment has reached extreme fear, and several indicators have moved closer to levels associated with previous cycle lows.
At the same time, other measures remain less extreme than prior major bottoms. Bitcoin reached its 200-week moving average but did not record a weekly close below it, MVRV Z-Score remains above deeply negative levels, and the correction remains shorter than the historical average measured from peak to bottom.
The broader market backdrop has also changed. Spot Bitcoin ETFs, corporate treasury strategies, sovereign adoption, stablecoin infrastructure, regulation and macro conditions have introduced dynamics that did not exist in previous cycles.
The data rhymes with previous cycle corrections. It does not fully rhyme with previous cycle bottoms.
Whether that gap eventually closes, or whether this cycle’s structural differences lead to a different outcome, remains one of the market’s central questions.
History does not provide certainty. It provides context. Used carefully, that context can help people ask better questions, manage risk more thoughtfully, and recognise which parts of history are repeating, and which parts are genuinely new.
That distinction is harder than it looks.
Like what you've been reading?
Check out our three part series: Understanding Today's Crypto Market here.
Ready to put your knowledge into action?
Whether you're just getting started or looking to build your long-term crypto portfolio, Digital Surge provides a simple and secure way to buy, sell and manage cryptocurrency in Australia.
Create your free account and start exploring the market today.